Repository Stats
![]()
![]()
![]()
This simple tool aims on open-source projects providing simple repository stats which are a bit out of scope of base Git and need some more information about issues and PRs.
Highlighted features
- cumulative caching (no need to full download, just incremental/needed update)
- collection of overall user contributions to issues/PRs
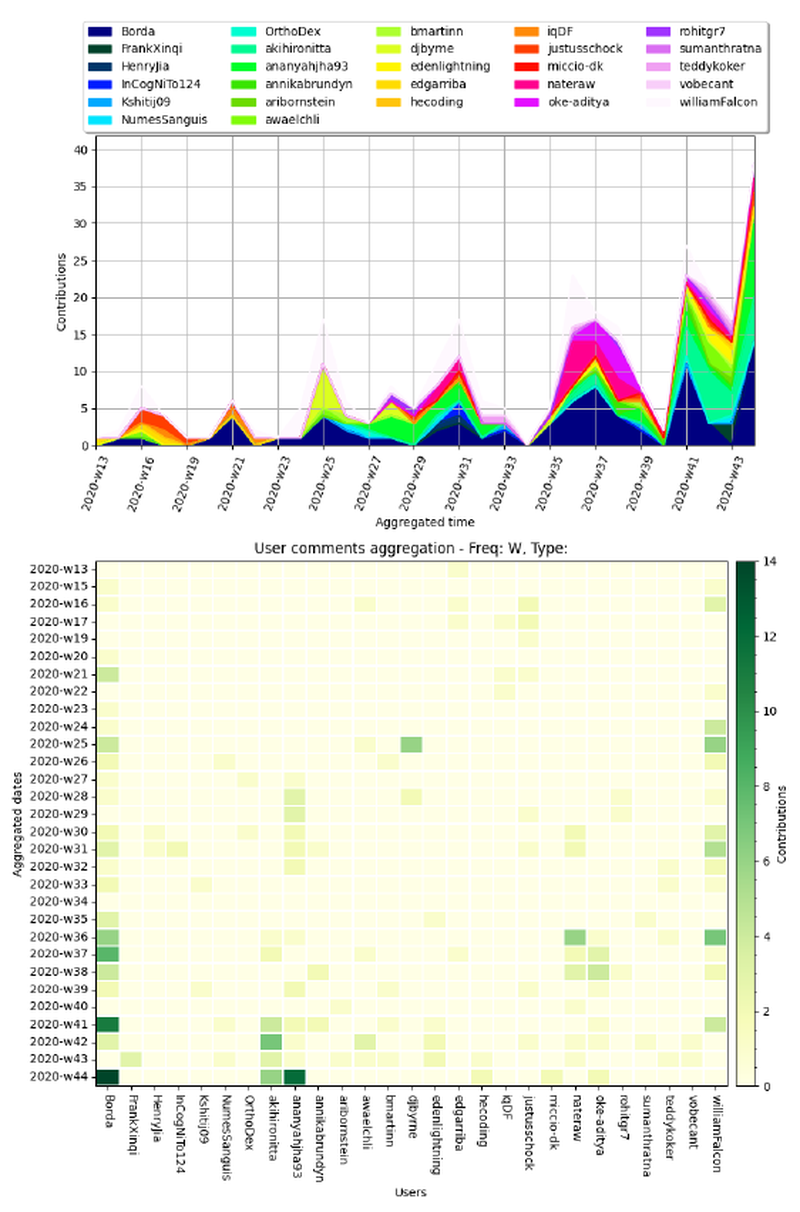
- visualization of aggregated timeline of past contributions
Installation
Simple install with setuptools/pip as
pip install https://github.com/Borda/pyRepoStats/archive/main.zip
or after cloning the repository
python setup.py install
Sample usage
The CLI provides two commands: scrape (fetch data from GitHub) and analyze (analyze cached data).
Basic command structure
# General format
repostat <command> <repository> [options]

# Or using python -m
python -m repo_stats <command> <repository> [options]
Available commands
scrape- Fetch repository data from GitHub (always requires internet connection)analyze- Analyze previously fetched data (works offline by default)
Examples
-
If you just clone this repo without installation, you need to install dependencies and call script:
pip install -r requirements.txt python src/repo_stats/__main__.py scrape PyTorchLightning/pytorch-lightning-bolts -
If you have already installed the package with
pipor withsetup.pyyou can call the executable:# Scrape (fetch) data from GitHub repostat scrape PyTorchLightning/pytorch-lightning-bolts --auth_token <your-personal-token> # Analyze the scraped data repostat analyze PyTorchLightning/pytorch-lightning-bolts --users_summary+ "all" -
Or use package with a pythonic way:
# Scrape data
python -m repo_stats scrape PyTorchLightning/pytorch-lightning-bolts

# Analyze data
python -m repo_stats analyze PyTorchLightning/pytorch-lightning-bolts --min_contribution 5
Note: When using python -m repo_stats, consider passing --output_path argument for output path, otherwise all caches and results will be saved in installation folder, most likely site-packages
To simplify the token passing in each call, you can export the token to environment variables export GH_API_TOKEN=<your-personal-token> for Github.
Github use-case
For GitHub users we recommend using your personal GitHub token which significantly increases request limit per hour.
Command-specific options
Use --help to see all available options for each command:
# See all commands
python -m repo_stats --help

# See options for scrape command
python -m repo_stats scrape --help

# See options for analyze command
python -m repo_stats analyze --help
Analyze command options
The analyze command provides various options for visualizing and summarizing repository data:
-
User summary table: Use
--users_summary+ "merged PRs" --users_summary+ "commented PRs" --users_summary+ "opened issues" --users_summary+ "commented issues"where the first column is used for sorting rows with users:Example command:
repostat analyze Borda/pyRepoStats --users_summary+ "merged PRs" --users_summary+ "opened issues"user merged PRs commented PRs opened issues commented issues williamFalcon 74 21 14 8 Borda 42 35 4 18 akihironitta 17 1 5 5 ananyahjha93 14 2 6 21 annikabrundyn 12 0 0 2 djbyrne 11 2 4 4 nateraw 9 1 6 8 teddykoker 3 2 0 0 -
Contribution filter: Use
--min_contribution Nto filter users by minimum number of contributions:repostat analyze Borda/pyRepoStats --min_contribution 10 --users_summary+ "all" -
Time frame filtering: Define a time frame with
--date_fromand--date_tofor filtering events - created issues, merged PRs and comments/reviews:repostat analyze Borda/pyRepoStats --date_from "2023-01-01" --date_to "2023-12-31" -
Contribution aggregation over time: Use
--user_comments+with time granularity (D=Day, W=Week, M=Month, Y=Year) to visualize contribution patterns:# Weekly aggregation repostat analyze Borda/pyRepoStats --user_comments+ W # Weekly aggregation for issues and PRs separately repostat analyze Borda/pyRepoStats --user_comments+ W --user_comments+ issue --user_comments+ pr # Multiple time sampling (weekly and monthly) repostat analyze Borda/pyRepoStats --user_comments+ W --user_comments+ MThis draws double charts: (a) cumulative aggregation over all users and (b) heatmap-like image with time on Y-axis and users on X-axis.
To deny showing figures set environment variable export SHOW_FIGURES=0.
Contribution
Any help or suggestions are welcome, pls use Issues :]